Trend & Anomaly Detection Advanced Power BI Visual
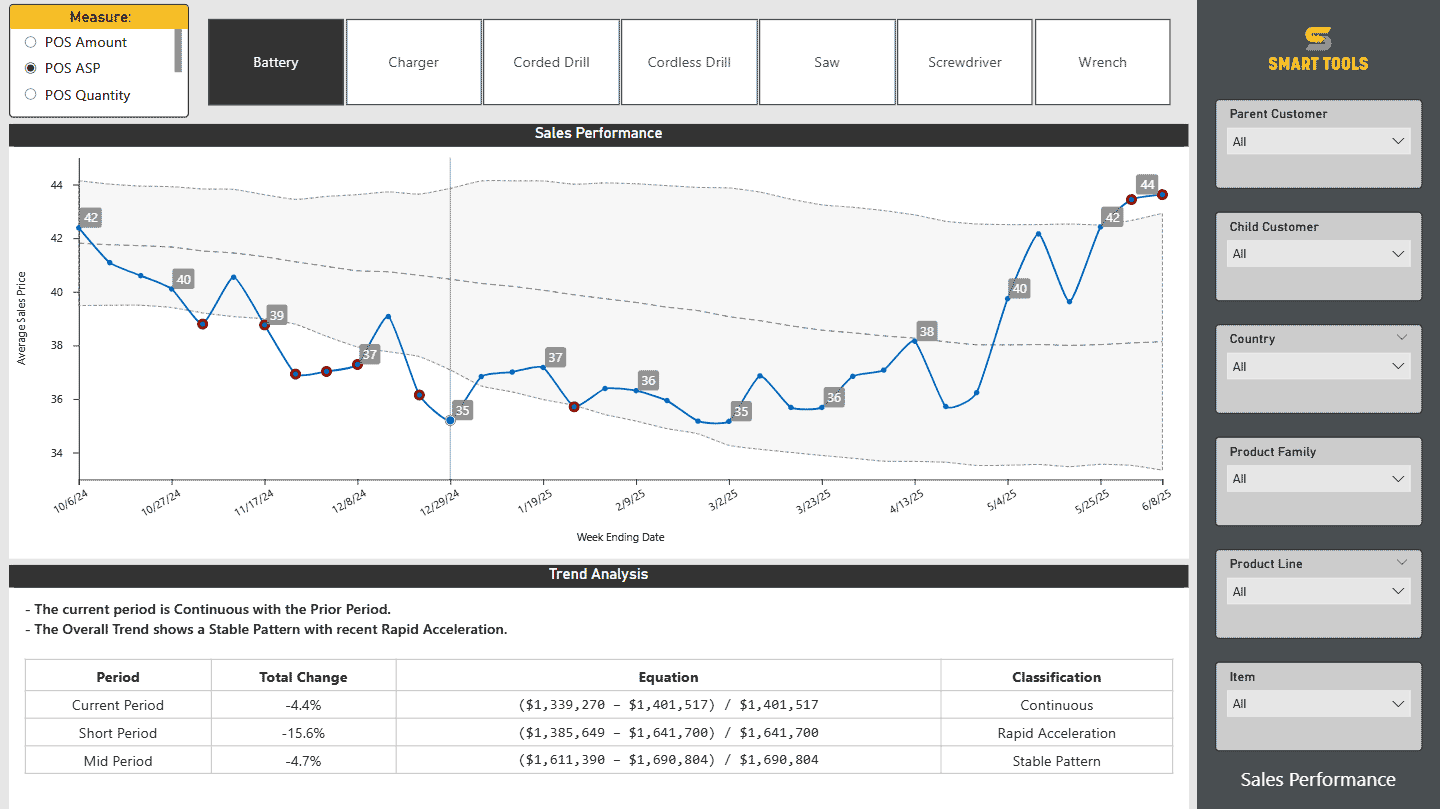
Spot shifts and anomalies in any time-series data so you can take action before they turn into costly surprises. The Trend & Anomaly Detection Advanced Power BI Visual goes far beyond a standard line chart. It shows short-, mid-, and long-term trends, highlights unusual patterns, and flags outliers automatically. Built-in statistical process control and Six Sigma support turns your raw time-series data into clear, decision-ready intelligence.
Who Benefits Most?
Data Analysts & BI Teams
Deeper statistical context directly inside Power BI dashboards.
Executives & Managers
Clear, actionable insights to make faster, data-driven decisions.
Quality Managers
Clear, actionable insights to make faster, data-driven decisions.
Finanical Analysts
Detect shifts in revenue, costs, or KPIs.
Operations Teams
Monitor process changes in real time.
Why This Visual - Key Benefits
Proactive—Highlights anomalies and trend shifts before they impact results.
Accurate—Built on proven statistical process control methods, not guesswork.
Customizable—Every element adapts to your reporting and branding needs.
Scalable—From a single dashboard to enterprise-wide deployment, it delivers consistent, reliable insights.
Business Impact
You can’t afford to wait for periodic reviews to discover problems. With this visual, you can:
Spot performance shifts early—Detect when sales, revenue, or production trends change direction.
Prevent costly surprises—Catch anomalies before they escalate into missed targets or operational failures.
Enable continuous improvement—Support SPC and Six Sigma practices for manufacturing, quality, and finance.
Drive faster decisions—Clear answers on when changes started and how significant they are.
Technical Details
Multi-Period Trend & Pattern Analysis—Segment data into short-, mid-, and long-term views; calculate rolling averages; and compare slopes to identify meaningful shifts.
Advanced Anomaly & Outlier Detection—Flag abnormal data points with configurable deviation bands; highlight high/low anomaly zones directly on the chart.
Process Stability—Built-in statistical process control (SPC) enables you to visualize control limits and out-of-control points with Six Sigma monitoring best practices.
Customization—Adjust line styles, colors, SPC zones and labels to match your Power BI theme and corporate branding.
Flexible Application—Use with any time-series data — sales, financial KPIs, manufacturing quality, operational metrics, web performance, and more.
Turn overwhelming manufacturing and distribution business data into clear, actionable insights—fast.