Trend & Anomaly Detection Advanced Power BI Visual
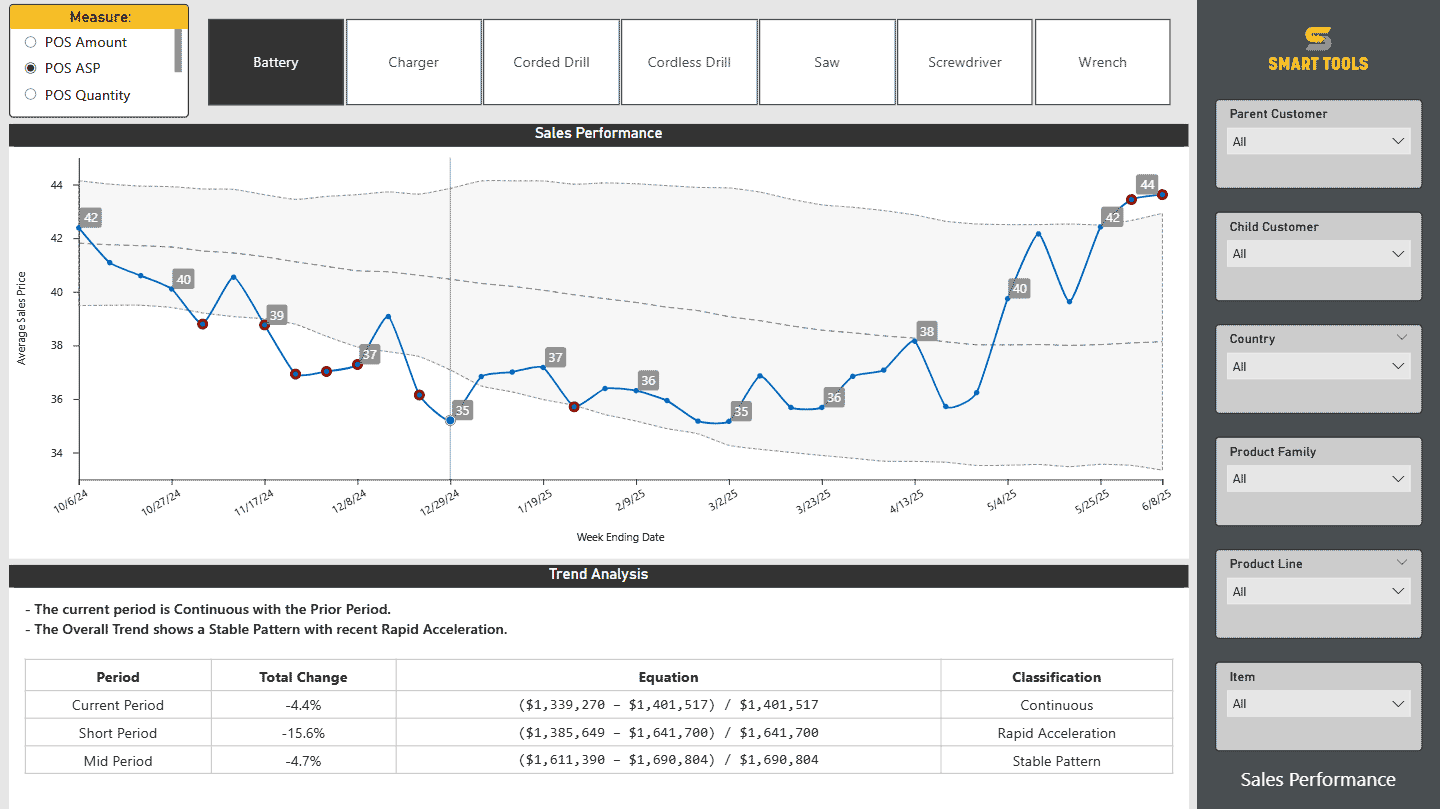
Spot trends shifts & anomalies in time-series data fast with built-in SPC and Six Sigma support.

Spot trends shifts & anomalies in time-series data fast with built-in SPC and Six Sigma support.